 |
|
|
|
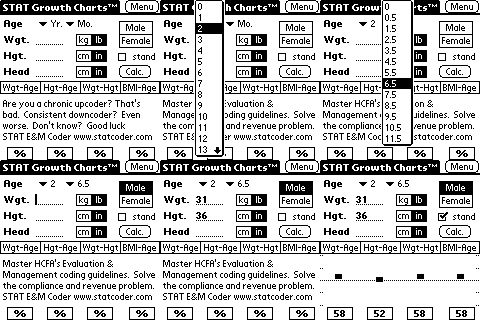
This is but one program available from STATCODER and developed by Andre S. Chen, M.D., MBA. Practitioners now can have a portable method for calculating growth percentiles in the 0-20 yr. age bracket. How many times have you been called or are returning a call to a referral source without the paper chart readily available. With the click of the stylus..you access 'growth chart', where you will find an amazing simple program for calculation. Parameters include sex, age (0-20) with the addition of months in a drop down menu. Weight and heights can be entered in both Metric and English versions. The same is true for head circumference that is entered in both as centimeters or inches. The calculations produce growth percentiles based on the National Center for Health Statistics and the CDC growth charts updated May 2000. The program produces these standard comparisons in both written percentiles and a graphic display: You will be prompted to select with recumbent or standing for height measurements.
A wonderful addition to this program is the BMI (body mass index) for age as a measure of childhood obesity. This is presented as a percentile number and graphical display. One main screen for display provides not only quick access for the provider, but also a single screen shot to show parents, family, or the patient themselves. From a pediatric nurse practitioner perspective, the only negative concerns the limited 0-36 mo. age for head circumference calculations. Many times we need to continue following this parameter/ utilize this measurement for assessment and diagnostic purposes for specialties. However because STAT GrowthCharts strictly adheres to the CDC Growth Charts, which does not include head circumference information beyond 36 months, we are not likely to see this feature until such a time as the CDC updates and/or changes their growth charts. Download in zipped version that includes the Growth Charts and mathlib (both are necessary to run all the calculations). 130 K's of memory are necessary for these programs. Sylvia Suszka- Hildebrandt, MN, ARNP, Editor PDA cortex
|
|||||||

